There is a substantial risk of loss associated with trading Derivatives . Losses can and will occur. My methods will not ensure profits

Monday, December 31, 2012

31122012

Nifty opened within previous day range.Traded within 8 point range for nearly four hours. Then a break out and fall back to the range. A classic text book Cigarette.I thought PDH will give some support after the breakout It did not happen and the profit vanished. Notice the range low is BRN 5900 of Spot Nifty

Wish you all a very happy and prosperous New Year.

Friday, December 28, 2012

28122012


Nifty gaped up above PDH. An Outside CT gap. As expected it channeled after the spike. Went long on the first pullback with SL below PDH. FTC above HOD gave a short. TP at the MSP. TST of LOD gave a long signal.I expected a break above HOD. But it did not happen

Thursday, December 27, 2012

Liquidity Pools

Look at the above picture. You might have seen this pattern many times.
Market is in a bull trend. It pull backs and makes a low at point A. Afterwards it goes up and later returns to the same price level and print a beautiful pin bar.
As a trader what will be your action in this area?
Some possibilities are
1.You will keep a stop loss order just below point A if you are holding long position
2.You will sell just below point A expecting a breakout to the down side
3.You will go long above the pin bar with a stop loss below the candle
Will you buy at the circled area?  Who bought there? Who absorbed both stop loss selling and breakout selling?  Why?


This is a copy paste of an earlier post titled Food for Thought. I had posted the same question in two major discussion forums namely Traderji and Indi Traders. Go through these threads.At least you can have an idea about the quality of content in these forums.
Now coming back to the subject.I have read tons of materials on trading. So far I have not seen any authors, bloggers or traders recommending to buy at the circled  area.Then who bought here ?

The answer is Big Money not Smart Money.Big Money is not always Smart Money. On many occasions Big Money will end up as Dumb Money. There are specific reasons for BM to place their orders here.

BM trade big and they can  be institutions, big funds or High net worth traders Generally they are higher time frame traders and do not bother about ten or fifteen point moves like retail traders.They never chase price . They will place their limit orders and let the market come to them and fill their orders quietly at the right price.

Now think about the above situation. Everybody knows a lot of sell orders exists below the previous support. There exists a "Liquidity Pool" .Where else can BM hide their buy orders ? Most of the retailers will end up providing liquidity to BM.

Market is a living organism. First priority of the Market is to ensure its own survival. Once the orders dry up it will move towards a "Liquidity Pool" where a lot of orders exist.Market will shake out many traders and will create order flow on its own.

Always pay attention to "Liquidity Pools". You will get a lot of trading opportunities around these areas.

27122012


Nifty opened within previous day closing range. Initial range formed. Made another range within IR.Went short on TST of Range High with SL above PDH/IRH. TP at BRN. Did not attempt any other trades due to expiry.

Wednesday, December 26, 2012

26122012

 I was not watching the market live. Nifty opened within previous day range and traded within a 10 point range for nearly two hours..forming a small cigarette pattern. A Direct breakout trade above PDH/IRH was a good one. BOF of range low was another opportunity to go long. A scratch trade
 

Friday, December 21, 2012

21122012

Nifty opened near PDL( wrongly marked as PDH in chart) and sold. IR formed. Almost all the day it moved within a small range. Attempted a long trade on BOF of Range Low. scratched later. Missed the final down move.

Thursday, December 20, 2012

Love Virgins


Trading, barring a few option strategies, requires price move. Unless we are able to anticipate the direction of the price move correctly and enter with a prudent stop loss, we will not be able to profit in the long run.

The first and foremost thing in profitable trading is to identify the price levels where we can initiate trades with a very favorable RR ratio. We need to identify “Actionable Levels”. These levels should be “Recognizable”, “Reactionable” and ‘Repeatable”. In fact this is a very simple task. Market itself will show you the levels it respected. I wonder why traders are spending their energy and time to find some calculated levels or some belief based levels when “Market Created” levels are right in front of them.

Rest is just finding tactics to trade these levels and gain the experience to read price action at these levels. The first part is relatively easy but the second part requires a lot of screen time and deliberate practice. This is applicable to all the trading methods and is not dependent on your identified price level or your method of identification.

All these levels are Make or Break levels. There are no permanent supports or resistances in Markets. Always, Market will be creating new levels and discarding the old levels. Better to give importance to the fresh levels. Tested and broken levels lose its importance and may not attract order flow as expected

Leave alone the used and abused levels. Trade the virgin levels.

20122012


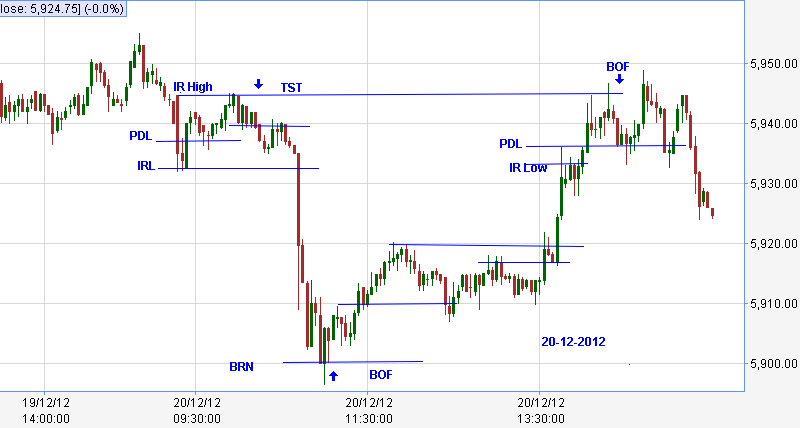
Nifty opened within previous day range. IR formed. BOF of PDL was the first signal to go long. Skipped as IRH was too close, Went short on TST of IR high.TP at BRN. Long at BOF of BRN. TP at IRL. .BOF of IR high failed to move and stopped out. Missed the final move down

Wednesday, December 19, 2012

19122012

Nifty opened above PDH. Attempted two long trades. Both the trades scratched. Entire day Nifty was within a 20 point range

Tuesday, December 18, 2012

18122012

Another announcement day. I am not very comfortable trading news and expiry. Cigarette pattern in the morning was a good signal.

Monday, December 17, 2012

17122012

Nifty opened within previous day range.IR Formed. BOF of IR high gave a short signal.. Exited when the BPB of IR Low failed to extend beyond the extreme. BOF of TR low gave a long signal. This one also failed to move. Scratched.

Friday, December 14, 2012

14122012

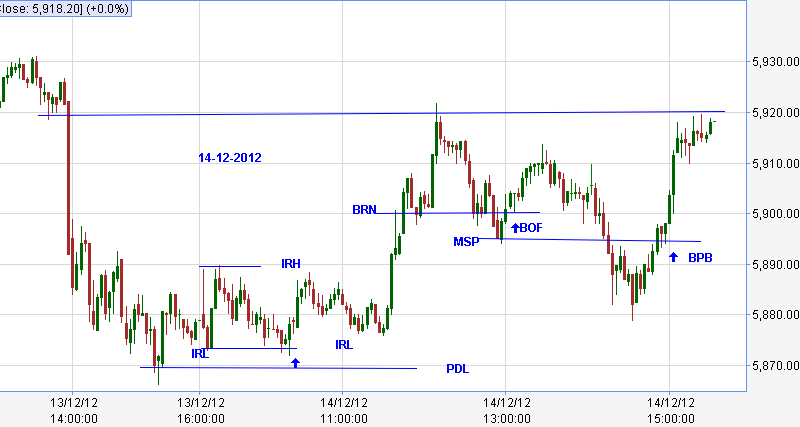
Nifty opened within previous day chop.IR formed without testing PDL. Went long on TST of IR low with a stop below PDL. It tested the patience for an hour and moved well. TP at yesterdays breakdown point. Again went long at BOF of BRN. Scratch trade. I was waiting to short the BPB of MSP and ended up going long on the BPB( or BOF?)  above the BRN. Did not break the HOD as expected.

Major Swing Pivots


As I have written earlier, my trading revolves around Decision Points. I expect traders to act forcefully at these levels. Major Swing Points ( MSP) are considered as decision points. MSP need some explanation. There are two types of MSP.

Auction markets produce a continuous stream of data. As we cannot process this raw data in real time, we chop it and chart it. We cut and package the data as per our own convenience and comfort level (Read)In fact the data is same for all time frame traders. In my opinion there is no need to look at a higher time frame chart as everything visible there, will appear much more prominent in your trading time frame. The problem with lower time frame is that if we start looking at lower time frame regularly, we will finally end up trading it.

Trends and time frames create a lot of confusion among traders. Most of this confusion can be avoided sticking to a single time frame. Even a single time frame trend can be confusing. It may appear in different levels. I will try to explain the important levels.
There are Micro, Minor and Major Trends in all time frames.

Micro trend is the lowest level trend. Successive candles making higher highs and higher lows make a micro up trend. Lower lows and lower high candles make a Micro down trend. Every candle Highs and Lows are pivots .These are called Micro Pivots

Extreme points where the Micro Trend change happens are Minor Pivots (A&B).Higher minor pivot highs and higher minor pivot lows make a Minor up trend. Lower Minor pivot highs and lows make a minor down trend.

Again extremes where a Minor Trend change happens are called Major Pivots. (C&D).
Higher major pivot highs and higher major pivot lows make a major up trend and the reverse a major down trend. These major pivots are considered as MSP. These levels are very much visible in higher time frame charts and will attract orders from higher time frame players.

Usually traders trade the Minor Trend of their trading time frame. Trend traders try to ride the trend and remain in the trade till the trend reverses. Most of the traders exit the trade when the swing pivot from where the move leading to the extreme cracks. Notice the last picture. Crack of pivot A is not considered as trend change. Crack of B is considered as trend change. A swing pivot, the break of which is considered as trend change is also counted as a MSP .MSP is the pivot low immediately preceding the highest high in an up trend and the pivot high immediately preceding the lowest low in down trend.Crack of MSP is considered as trend change

As usual do not think too technical and do not be too rigid in your definitions. Now forget everything .Keep it simple. If a swing pivot looks prominent, treat it as MSP and watch price action around this area.
“If it looks like a duck, quacks like a duck and walks like a duck, it's a duck"

Thursday, December 13, 2012

13122012

Nifty opened within previous day closing range and traded there till 2o clock. First trade was a BOF trade of IR high. TP at TR low.When the third attempt to go below failed I went long . Nifty suddenly reversed and jumped over my stop without filling it. A 30 point loss for me after a long long time.I really forgot about the Cigarette pattern

Wednesday, December 12, 2012

12122012

Nifty opened within previous day range and traded within a 30 point range the whole day..Two short trades of BOF of IR High moved to the other extreme of the range as expected.. BOF of range low did not move and scratched this trade.

Tuesday, December 11, 2012

11122012


Nifty gaped up above PDH.An outside counter trend gap ( Read ). Entered on the open with a stop below PDH.A wide IR formed.The LOL, BOF of IRH and BRN was a short signal. Skipped it because I suspected a channel move and MSP was too close. Shorted on the BPB of MSP. A momentum move breaking DO,IR Low,PDH,PDC, and PDL.finally stopped at BRN 5900. LOL BOF of LOD and BRN 5900 gave another long signal.
I think , I have not explained the concept of MSP ( Major Swing Pivot). I will make a separate post on this.

Monday, December 10, 2012

10122012


Nifty opened within previous day range.IR formed. Went long on BOF of IR Low/PDL. TP at IR high. Short on retest of IR High.Scratched the trade when the second attempt to go below 5940 failed. BOF of PDL gave a long signal.TP at IR High. BOF of LOD gave another long. Covered at IRH.Nifty was within 25 point range the whole day and neither of the trades move  as expected.

Friday, December 7, 2012

07122012


Nifty opened near PDH and did not attempt to break it. IR formed. Went short on FTC above IR High with stop above PDH. Breakout of IR Low failed to extend. Scratched the trade. Envelope formed around IR. Short on TST of IR high.. This moved well. Did not attempt any other trade as I expected a chop due to weekend and FDI problem.

Enduring Edge

Anyone can win a few trades randomly. Tipsters can always show you some big winners and conveniently hide their losers. Luck is not an edge in the market. Edge is all about finding trades after trades that are profitable and pulling out money from the Market day after day.

The first step to trading consistency is to find an edge in the Market. If you want to be a successful trader, you need to build an "Enduring edge". An enduring edge is something permanent and will not change over time. In other words, it is structural and is based on some fundamental understanding of how Market works. It is rooted in the behavior of the Market.

The easier way is to build your trading method around some proven behavior of the Market. There are so many Market Anomalies on which you can work. These are thoroughly researched and statistically proven concepts. All the profitable methods are developed around these proven anomalies. Focus on something that is applicable to your time frame and work on it.

My trading method is built around Price Flips which is a very basic character of all the Auction Markets. An understanding of price flips will enable an enterprising person to formulate any number of satisfactory trading tactics on this.

Do not make the mistake of ignoring this topic and running behind the new indicator . Take a New Years resolution NOW to work on a proven market anomaly and to find an Enduring Edge.

Thursday, December 6, 2012

06122012

Nifty opened at PDH and sold. I could not initiate a trade and missed the entire down move.Went long on the BOF of Range Low. TP at Range high.BOF of Range High gave a short signal. Stopped out. BPB of Range High gave a long signal.Even though it did not pull back to the breakout point , it was within the Risk level. Stop was very safe below the Range high and BRN.Rest was a VWAP play. Notice the screenshot at 3.20 PM. Nearly 70 point difference.

Wednesday, December 5, 2012

05122012


Nifty gaped above PDH . IR formed which was very narrow.. Bias was bullish . I was expecting a drift down to PDH. But an Envelop  formed around the IR. . Went long on the TST of Range low. BOF of HOD gave a short signal. Nifty was trading within a 25 point range the whole day..Always pay attention to flip zones. Notice how the Flip Zone acted as support today.

Tuesday, December 4, 2012

04122012

Nifty opened within previous days range. Market has become very choppy and operators are undecided. Better to limit your trades to extremes in such cases. Today BOF of range high and BOF of LOD gave good moves..

Monday, December 3, 2012

03122012

Nifty opened within previous day range. BOF of the PDH gave a short signal. Rest of the day market moved within a 15 point range. A Barbed Wire around the BRN 5900