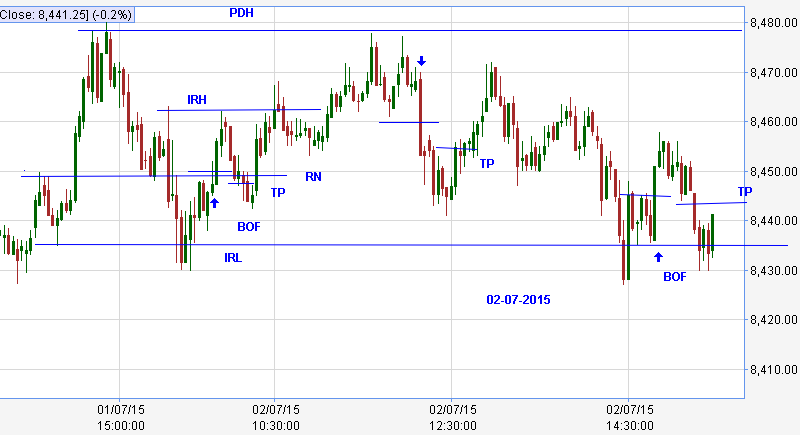
This is an illustrative example of the concepts being discussed.Markings are just visualizations on historical data in hindsight analysis
Nifty traded within the previous day last impulse. Price action within the range was too choppy. The move up and down were like channels. Attempted three trades. Two longs and one short. Nothing worked.

Thanks for the chart ST. I took a short below 1:30 , obviously wrong. Please tell me what I should have been thinking at that time.
ReplyDeleteYour short was good and met its logical target, Range low
DeleteHope you could manage the bounce. Trading is all about taking chances.
Trade had the potential to run
ST
Hi ST, I scratched around xx46. Where should I have exited. Is the IRL drawn on previous day MSP? Thanks again ST.
DeletePrice reversed too fast and made action difficult . Right exit is at BO candle high
DeleteIRL is at 8430. Line was at MSP, last impulse low. Forgot to draw line at IRL
ST
Thanks a lot ST
DeleteThank you ST.
ReplyDeleteST,
ReplyDeleteHow you could avoid shorting BOF at 11.39? or was it wrong trade to take.
Regards
Bharat
Price was channeling up without respecting flips and was making new swing highs.
DeleteSignal was not at a DP .Thought of shorting only after price failed to make a new high
ST