Monday, December 31, 2012

31122012

Nifty opened within previous day range.Traded within 8 point range for nearly four hours. Then a break out and fall back to the range. A classic text book Cigarette.I thought PDH will give some support after the breakout It did not happen and the profit vanished. Notice the range low is BRN 5900 of Spot Nifty

Wish you all a very happy and prosperous New Year.

Friday, December 28, 2012

28122012


Nifty gaped up above PDH. An Outside CT gap. As expected it channeled after the spike. Went long on the first pullback with SL below PDH. FTC above HOD gave a short. TP at the MSP. TST of LOD gave a long signal.I expected a break above HOD. But it did not happen

Thursday, December 27, 2012

Liquidity Pools

Look at the above picture. You might have seen this pattern many times.
Market is in a bull trend. It pull backs and makes a low at point A. Afterwards it goes up and later returns to the same price level and print a beautiful pin bar.
As a trader what will be your action in this area?
Some possibilities are
1.You will keep a stop loss order just below point A if you are holding long position
2.You will sell just below point A expecting a breakout to the down side
3.You will go long above the pin bar with a stop loss below the candle
Will you buy at the circled area?  Who bought there? Who absorbed both stop loss selling and breakout selling?  Why?


This is a copy paste of an earlier post titled Food for Thought. I had posted the same question in two major discussion forums namely Traderji and Indi Traders. Go through these threads.At least you can have an idea about the quality of content in these forums.
Now coming back to the subject.I have read tons of materials on trading. So far I have not seen any authors, bloggers or traders recommending to buy at the circled  area.Then who bought here ?

The answer is Big Money not Smart Money.Big Money is not always Smart Money. On many occasions Big Money will end up as Dumb Money. There are specific reasons for BM to place their orders here.

BM trade big and they can  be institutions, big funds or High net worth traders Generally they are higher time frame traders and do not bother about ten or fifteen point moves like retail traders.They never chase price . They will place their limit orders and let the market come to them and fill their orders quietly at the right price.

Now think about the above situation. Everybody knows a lot of sell orders exists below the previous support. There exists a "Liquidity Pool" .Where else can BM hide their buy orders ? Most of the retailers will end up providing liquidity to BM.

Market is a living organism. First priority of the Market is to ensure its own survival. Once the orders dry up it will move towards a "Liquidity Pool" where a lot of orders exist.Market will shake out many traders and will create order flow on its own.

Always pay attention to "Liquidity Pools". You will get a lot of trading opportunities around these areas.

27122012


Nifty opened within previous day closing range. Initial range formed. Made another range within IR.Went short on TST of Range High with SL above PDH/IRH. TP at BRN. Did not attempt any other trades due to expiry.

Wednesday, December 26, 2012

26122012

 I was not watching the market live. Nifty opened within previous day range and traded within a 10 point range for nearly two hours..forming a small cigarette pattern. A Direct breakout trade above PDH/IRH was a good one. BOF of range low was another opportunity to go long. A scratch trade
 

Friday, December 21, 2012

21122012

Nifty opened near PDL( wrongly marked as PDH in chart) and sold. IR formed. Almost all the day it moved within a small range. Attempted a long trade on BOF of Range Low. scratched later. Missed the final down move.

Thursday, December 20, 2012

Love Virgins


Trading, barring a few option strategies, requires price move. Unless we are able to anticipate the direction of the price move correctly and enter with a prudent stop loss, we will not be able to profit in the long run.

The first and foremost thing in profitable trading is to identify the price levels where we can initiate trades with a very favorable RR ratio. We need to identify “Actionable Levels”. These levels should be “Recognizable”, “Reactionable” and ‘Repeatable”. In fact this is a very simple task. Market itself will show you the levels it respected. I wonder why traders are spending their energy and time to find some calculated levels or some belief based levels when “Market Created” levels are right in front of them.

Rest is just finding tactics to trade these levels and gain the experience to read price action at these levels. The first part is relatively easy but the second part requires a lot of screen time and deliberate practice. This is applicable to all the trading methods and is not dependent on your identified price level or your method of identification.

All these levels are Make or Break levels. There are no permanent supports or resistances in Markets. Always, Market will be creating new levels and discarding the old levels. Better to give importance to the fresh levels. Tested and broken levels lose its importance and may not attract order flow as expected

Leave alone the used and abused levels. Trade the virgin levels.

20122012


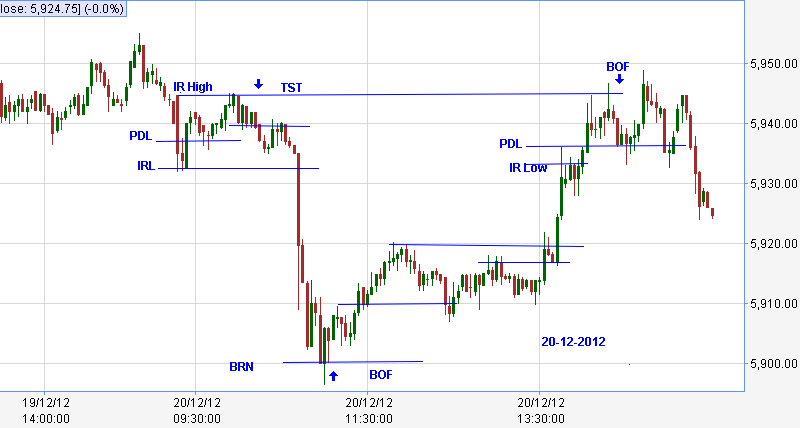
Nifty opened within previous day range. IR formed. BOF of PDL was the first signal to go long. Skipped as IRH was too close, Went short on TST of IR high.TP at BRN. Long at BOF of BRN. TP at IRL. .BOF of IR high failed to move and stopped out. Missed the final move down

Wednesday, December 19, 2012

19122012

Nifty opened above PDH. Attempted two long trades. Both the trades scratched. Entire day Nifty was within a 20 point range

Tuesday, December 18, 2012

18122012

Another announcement day. I am not very comfortable trading news and expiry. Cigarette pattern in the morning was a good signal.

Monday, December 17, 2012

17122012

Nifty opened within previous day range.IR Formed. BOF of IR high gave a short signal.. Exited when the BPB of IR Low failed to extend beyond the extreme. BOF of TR low gave a long signal. This one also failed to move. Scratched.

Friday, December 14, 2012

14122012

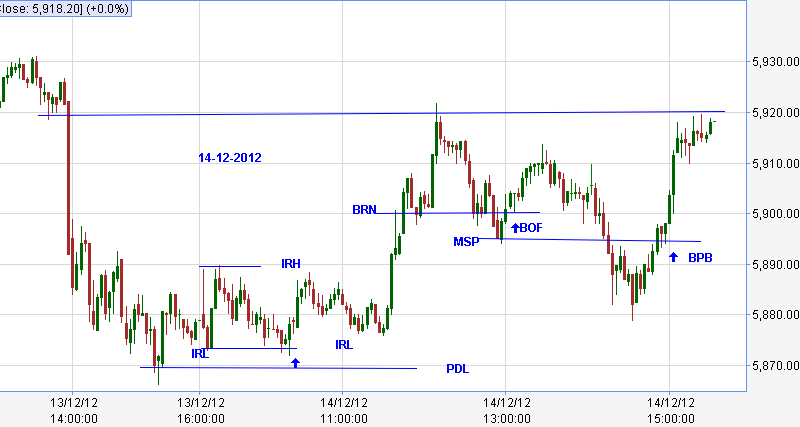
Nifty opened within previous day chop.IR formed without testing PDL. Went long on TST of IR low with a stop below PDL. It tested the patience for an hour and moved well. TP at yesterdays breakdown point. Again went long at BOF of BRN. Scratch trade. I was waiting to short the BPB of MSP and ended up going long on the BPB( or BOF?)  above the BRN. Did not break the HOD as expected.

Major Swing Pivots


As I have written earlier, my trading revolves around Decision Points. I expect traders to act forcefully at these levels. Major Swing Points ( MSP) are considered as decision points. MSP need some explanation. There are two types of MSP.

Auction markets produce a continuous stream of data. As we cannot process this raw data in real time, we chop it and chart it. We cut and package the data as per our own convenience and comfort level (Read)In fact the data is same for all time frame traders. In my opinion there is no need to look at a higher time frame chart as everything visible there, will appear much more prominent in your trading time frame. The problem with lower time frame is that if we start looking at lower time frame regularly, we will finally end up trading it.

Trends and time frames create a lot of confusion among traders. Most of this confusion can be avoided sticking to a single time frame. Even a single time frame trend can be confusing. It may appear in different levels. I will try to explain the important levels.
There are Micro, Minor and Major Trends in all time frames.

Micro trend is the lowest level trend. Successive candles making higher highs and higher lows make a micro up trend. Lower lows and lower high candles make a Micro down trend. Every candle Highs and Lows are pivots .These are called Micro Pivots

Extreme points where the Micro Trend change happens are Minor Pivots (A&B).Higher minor pivot highs and higher minor pivot lows make a Minor up trend. Lower Minor pivot highs and lows make a minor down trend.

Again extremes where a Minor Trend change happens are called Major Pivots. (C&D).
Higher major pivot highs and higher major pivot lows make a major up trend and the reverse a major down trend. These major pivots are considered as MSP. These levels are very much visible in higher time frame charts and will attract orders from higher time frame players.

Usually traders trade the Minor Trend of their trading time frame. Trend traders try to ride the trend and remain in the trade till the trend reverses. Most of the traders exit the trade when the swing pivot from where the move leading to the extreme cracks. Notice the last picture. Crack of pivot A is not considered as trend change. Crack of B is considered as trend change. A swing pivot, the break of which is considered as trend change is also counted as a MSP .MSP is the pivot low immediately preceding the highest high in an up trend and the pivot high immediately preceding the lowest low in down trend.Crack of MSP is considered as trend change

As usual do not think too technical and do not be too rigid in your definitions. Now forget everything .Keep it simple. If a swing pivot looks prominent, treat it as MSP and watch price action around this area.
“If it looks like a duck, quacks like a duck and walks like a duck, it's a duck"

Thursday, December 13, 2012

13122012

Nifty opened within previous day closing range and traded there till 2o clock. First trade was a BOF trade of IR high. TP at TR low.When the third attempt to go below failed I went long . Nifty suddenly reversed and jumped over my stop without filling it. A 30 point loss for me after a long long time.I really forgot about the Cigarette pattern

Wednesday, December 12, 2012

12122012

Nifty opened within previous day range and traded within a 30 point range the whole day..Two short trades of BOF of IR High moved to the other extreme of the range as expected.. BOF of range low did not move and scratched this trade.

Tuesday, December 11, 2012

11122012


Nifty gaped up above PDH.An outside counter trend gap ( Read ). Entered on the open with a stop below PDH.A wide IR formed.The LOL, BOF of IRH and BRN was a short signal. Skipped it because I suspected a channel move and MSP was too close. Shorted on the BPB of MSP. A momentum move breaking DO,IR Low,PDH,PDC, and PDL.finally stopped at BRN 5900. LOL BOF of LOD and BRN 5900 gave another long signal.
I think , I have not explained the concept of MSP ( Major Swing Pivot). I will make a separate post on this.

Monday, December 10, 2012

10122012


Nifty opened within previous day range.IR formed. Went long on BOF of IR Low/PDL. TP at IR high. Short on retest of IR High.Scratched the trade when the second attempt to go below 5940 failed. BOF of PDL gave a long signal.TP at IR High. BOF of LOD gave another long. Covered at IRH.Nifty was within 25 point range the whole day and neither of the trades move  as expected.

Friday, December 7, 2012

07122012


Nifty opened near PDH and did not attempt to break it. IR formed. Went short on FTC above IR High with stop above PDH. Breakout of IR Low failed to extend. Scratched the trade. Envelope formed around IR. Short on TST of IR high.. This moved well. Did not attempt any other trade as I expected a chop due to weekend and FDI problem.

Enduring Edge

Anyone can win a few trades randomly. Tipsters can always show you some big winners and conveniently hide their losers. Luck is not an edge in the market. Edge is all about finding trades after trades that are profitable and pulling out money from the Market day after day.

The first step to trading consistency is to find an edge in the Market. If you want to be a successful trader, you need to build an "Enduring edge". An enduring edge is something permanent and will not change over time. In other words, it is structural and is based on some fundamental understanding of how Market works. It is rooted in the behavior of the Market.

The easier way is to build your trading method around some proven behavior of the Market. There are so many Market Anomalies on which you can work. These are thoroughly researched and statistically proven concepts. All the profitable methods are developed around these proven anomalies. Focus on something that is applicable to your time frame and work on it.

My trading method is built around Price Flips which is a very basic character of all the Auction Markets. An understanding of price flips will enable an enterprising person to formulate any number of satisfactory trading tactics on this.

Do not make the mistake of ignoring this topic and running behind the new indicator . Take a New Years resolution NOW to work on a proven market anomaly and to find an Enduring Edge.

Thursday, December 6, 2012

06122012

Nifty opened at PDH and sold. I could not initiate a trade and missed the entire down move.Went long on the BOF of Range Low. TP at Range high.BOF of Range High gave a short signal. Stopped out. BPB of Range High gave a long signal.Even though it did not pull back to the breakout point , it was within the Risk level. Stop was very safe below the Range high and BRN.Rest was a VWAP play. Notice the screenshot at 3.20 PM. Nearly 70 point difference.

Wednesday, December 5, 2012

05122012


Nifty gaped above PDH . IR formed which was very narrow.. Bias was bullish . I was expecting a drift down to PDH. But an Envelop  formed around the IR. . Went long on the TST of Range low. BOF of HOD gave a short signal. Nifty was trading within a 25 point range the whole day..Always pay attention to flip zones. Notice how the Flip Zone acted as support today.

Tuesday, December 4, 2012

04122012

Nifty opened within previous days range. Market has become very choppy and operators are undecided. Better to limit your trades to extremes in such cases. Today BOF of range high and BOF of LOD gave good moves..

Monday, December 3, 2012

03122012

Nifty opened within previous day range. BOF of the PDH gave a short signal. Rest of the day market moved within a 15 point range. A Barbed Wire around the BRN 5900

Friday, November 30, 2012

30112012

Nifty gaped up above PDH. IR formed . Entered long on the retest of the level after BOF of IR low.. Second trade was also a long trade . BOF of BRN 5900.Bulls are not willing to liquidate their position it seems.

Thursday, November 29, 2012

Win More, Lose Less


I had written an earlier post about the three stages of trader development. (Read). This includes defining the structure of the Market and finding ways to trade the moves within this structure. Rest is gaining practice and experience to execute your methods without hesitation.

So it comes down to a method with an edge and execution skill that will not erase the edge in the method. Edge is simply the positive expectancy of the method and this positive expectancy is not a result by chance. Edge is non randomness.

How do we know our selected method is having an edge?  It is very simple. The method will win more and lose less.

Win More, Lose Less
 Most of the trading methods barring few option strategies require directional price movement. We are betting on these price moves. We win by accurately assessing these directional moves. If we are right more than we are wrong in this skill, we will win more and lose less.

Win More, Lose Less
We must win more money if we are right than what we lose if we are wrong. The gain we achieve if we hit our target should be more than the loss we suffer when we get stopped out. In other words Risk/Reward should be favorable

Win More, Lose Less
We need to bet big and win more when we are right. All trading opportunities are not equal. Betting big on high probability trades and being modest on lower probability situations will boost our performance. Position management is very important in trading.

Almost all  the new traders focus only on the first thing as they want to be right always and out smart the market. Real break through in trading will come once you shift your focus on to the other two.

29112012

Nifty opened above PDH and moved 90 points. I was not able to capture any move.There was no reliable signal to enter early. Being expiry, I was not comfortable to initiate a position around BRN 5800

Tuesday, November 27, 2012

27112012


Market gaped up above PDH and spiked without giving a pull back. IR formed.Expectation was a channel move. Did not enter on first pull back as it was below BRN 5700.BPB of BRN gave a long signal.

Monday, November 26, 2012

Trading the Illusions

Most of the traders are trying to trade the illusions. Once you understand the framework within which the price moves everything becomes clear. Defining the structure of the Market is the first step to trading consistency.

26112012

Nifty Opened just above PDH . First bar acted as IR. FTC above IR High gave a short signal . Entered on break of PDH. TP when PDC held. Another short below PDH on TST of HOD suddenly reversed. Stopped out .Missed the BOF of HOD.Nifty traded within a 20 point range the whole day.

Friday, November 23, 2012

Anchoring

If you visit Kerala during monsoon season ,you can find many hawkers from North India selling blankets and sweaters.They come in groups and sell their stock door to door.They follow a unique selling strategy. First Some of them will go to the villages and quote shockingly high prices for their products.They wont reduce their price and will not be able to sell much.

After a few days another group will come. They will move down the price and convince villagers that they are selling at a discount because the season is over and they have to go back to their native places.People think this  price as bargain comparing with the old price and happily buy out.

This behavior is called Anchoring in behavioral finance.Investors are anchoring when they buy a stock that has fallen a lot without a second thought. They are mentally anchored in the price it was trading before the crash. That makes the present price look like a bargain. Such Anchoring could be injurious to your financial health

Price action trading works because of Anchoring. Traders notice the price levels where the market turned earlier and act there again.These are the ideal locations to initiate trades with the lowest risk.Decision Points and Flip Zones are  nothing but anchoring points.

Half of the battle is won if you know where to initiate the trades.

23112012

Market opened within previous day range. Initial range formed. Could not short IR low break as there was no pull back. Skipped BPB of PDL as the market had already moved nearly 40 points. BOF of BRN gave a long signal this trade moved well.Paying attention to flip area is very important. Notice A here the flip zone failed to hold One can safely short at a with a SL above HOD.If you notice flip zone B you will never exit the BOF trade of BRN. here and will never short here as BOF of PDL

Thursday, November 22, 2012

22112012

Market opened above PDH. I was looking to go long. IR formed. Notice the area marked A We will be tempted to go long here. But notice the flip zone just above.Better to wait till the price breaks above the flip zone.Went short on the BPB of PDH. Scratched this trade. Missed the days major move, BOF of PDC

Wednesday, November 21, 2012

R I P, Mini

Rest in peace, Mini. Don't get upset.Mini is neither my relative nor a regular reader of the blog. It is the derivative contract called Mini Nifty.

SEBI has instructed the exchanges to discontinue mini derivative contracts on Index.According to them , the action is to ensure that small/retail investors are not attracted towards derivative segment.They feel  Mini lots are attracting too many small players !

Mini contracts were introduced in 2007 with a minimum contract size of one lakh. The purpose was to attract more retail participation. So far I could not understand the logic behind this.Reducing the lot size of Nifty from 50 to 20 was a better option.This could have avoided the split of volume. Then Nifty would have become much more liquid . Bigger traders can always go for multiple lots

Now SEBI has reversed their position. Their priority is  to ensure retail traders and small investors are  not getting hurt, playing with the weapons of mass destruction.This is absurd. Don't they know index futures are cash settled and requires very little margin to trade ? Are they thinking that additional margin of Rs 10000/- will discourage these traders ? In reality this action will ensure retail traders lose 2.50 times more .

The message is very clear. SEBI do not want retailers to trade derivatives. So what else we can expect? More stringent measures like  hiking  the margins to 100% ?. You can expect an increase in STT also

Go ahead SEBI. Go and kill the Market.

21112012


Market opened within previous day range.IR formed. FTC below IR low gave a long signal. BPB of IR high was another opportunity. Skipped the BOF of PDH as it was channeling. BOF of BRN gave another long trade.

Tuesday, November 20, 2012

20112012

Nifty gaped up above PDH. Long on BOF of PDH. with SL below BRN. Stopped out. Went short below BRN on BPB of PDH. BPB of PDC gave another short which moved well. BOF of PDL was also a good trade.

Trading Cults


Traditionally “cult” was a term used for any new religious movement. In fact it is applicable to all walks of life .Broadly it is a group of people intensely devoted to a person, idea, or a movement.

Do we have “Cults” in trading? Yes. I have seen many sites, blogs and forums showing cult behavior. Many of them were started with the noble intention of helping the new traders. Unfortunately most of them have become “cults” over time. If you closely observe, it is very easy to identify cult behaviors.
  • The Guru and his teachings are always right, and above criticism. They always glorify the leader. Guru remains a noble gentleman and always the loyal seniors deal with critics.
  • Members will be encouraged to confess all their faults and mistakes. They will make you inferior and guilty projecting the leader as a super human. You will never understand you are comparing your performance with something which is not achievable by a beginner.
  • The standard answer to your question is a quote from the leader. Members are expected to parrot those answers. Independent or critical thinking is not encouraged. Critical thoughts about the leader or the group are discouraged.
  • They make you believe that, what they are doing is of a higher purpose than what anyone else is doing. Others are just doing it for their own sake but Cult members are transforming, building, achieving and doing great things.
  • They will provide you a ready-made extended family when you join the group and you will start spending all of your spare time with other members, who are your new circle of friends and will never grow beyond this.
  • There are always a few cult members around who proclaim that it is all so wonderful. They rave about how wonderful this group and leader is, and claim they are all making great progress following the Master.
  • Sometimes the leader rewards a member with an open praise. Other members will flock to congratulate him and the poor guy feels as if he has achieved something great. Leader only rewards, it is the duty of the seniors to fix you.

You will not get the promised benefits from any of these cults. You just get used and abused. Finally you will become disillusioned and discarded. Avoid Cults like plague.


“It’s your life — but only if you make it so. The standards by which you live must be your own standards, your own values, your own convictions in regard to what is right and wrong, what is true and false, what is important and what is trivial. When you adopt the standards and the values of someone else or a community or a pressure group, you surrender your own integrity. You become, to the extent of your surrender, less of a human being.”

Eleanor Roosevelt

Monday, November 19, 2012

19112012

Nifty opened within previous day range. BOF of BRN gave a short signal. PDL gave support.Attempted two BOF trades of PDL.Both these trades did not move as expected to Overlap range bigh

Friday, November 16, 2012

Thou Shalt Fear


Experiencing fear is normal in trading. In fact, fear is considered as a basic survival mechanism. Without fear, we won't be able to recognize danger and respond appropriately. Fear warns you that something doesn't feel right about a trade, you should try to figure out what exactly is going wrong

Fear may force us to make a decision that goes against good trading habits. It may make us violate our trading plan. We probably go through one of the following at least once every trading session

  • We fear our winners will turn into losers and exit, missing bigger profits
  • We fear losing money and hold on to losing trades longer, losing more money
  • We fear to lose and skip valid trades.
  • We fear missing trades and over trade.
  • We fear the unknown, we fear the uncertainty.of trading.

No matter how much better we become, we will never stop feeling afraid. No matter how much more experience we get, we will never stop feeling afraid. Trading psychologists may not agree. They will swear and promise us to take our trading psychology beyond fear and help us achieve peak performance. Let them. It is their bread and butter.  

There is no other way but to accept fear as a constant companion. The only thing I can tell you is that while the fear never goes away, the more you work through it the easier it becomes to handle.

16112012

Open within previous day range. IR formed. TST of PDH gave a short signal. It went exactly where it is supposed to go, the IR low.Went long when the second push down failed. TP at PDH. Short on BOF of PDH. BPB of IR LOw was an opportunity to add to the position.

15112012

Nifty gaped down below PDL. Bias was bearish. First candle acted as IR. Short when Nifty failed to go above DO/HOD/IR High.Skipped the counter trend BOF of LOD.

Monday, November 12, 2012

12112012

Nifty opened within previous day range. Previous days last down move acted as a range. FTC above IR high gave a short signal. TP at PDL. Did not attempt the BOF  of  PDL

Friday, November 9, 2012

09112012

Nifty opened within previous day range. BOF of  PDH gave a short signal.TP at IR Low..BPB of IR Low gave another short signal.This trade moved till BRN  5700 and gave very good profit.

Thursday, November 8, 2012

Make-or-Break Levels.


Imagine a Tennis ball hitting your window pane. What will happen? It may break the glass or bounce back, depending upon your “Head Line”. If you are destined to ruin your weekend, hunting for somebody to fix it, nothing can help. The ball may even break your prized flower vase.

In reality it depends on many factors such as the strength of the glass, speed of the ball, force with which the ball is hit, and how far the ball has traveled. The angle of hit is also important so is the barriers it encountered on the way which might have reduced the impact.

Time and again I have written that my trading revolves around Decision Points. Decision Points are Make or Break levels, which may hold or yield. Acceptance or rejection of price at these levels decides my course of action. We will never know for sure what will happen when price interacts with decision points. But we will be able to anticipate it correctly, most of the time, if we are paying attention to details.

This includes Strength of the Decision Point, trend strength, and origin of the move. How far the move has traveled and barriers encountered on this move is also important. I had explained the strength of the Decision Point in an earlier post.

There are three ways to assess the trend strength. These are.
  • Extensions. Notice how far an impulse wave moves over the previous swing high. Compare with the previous extension. If it is more, trend is accelerating.
  • Dips. Watch how deep the pull backs are. Compare with the earlier one. Deeper pullbacks denote less strength.
  • Angle of the move. Looking at the angle of the move we can see whether the trend is slowing or gaining momentum.

Origin of the move is very important. A move after a BOF will have much more strength than a move after a TST or FTC as there will be trapped traders trying to exit.

How far the move has traveled is another factor. If it has already moved 20-30 points in Nifty Futures, early entrants will start booking their profit on the first sign of a resistance. This will slow down the move.

Arrival of price at the DP is very important. If price consolidates just before the DP for a while, it will attract stop orders above this consolidation. Once price breaks above this, these stops may trigger and provide enough order flow to break the DP

Always pay attention to the details. Never ignore the small stuff.

Please note that I have shown only the "Long" example. The concepts are applicable to " Short" side equally well

08112012


Nifty gaped down and found support at PDL. Went long on the first pullback with stop below LOD and PDL.It channeled for a while. Exited the trade when the channel broke.Nifty reversed at DO without testing PDL. Missed this long trade.Went short at the BOF of HOD. Scratched this trade as it refused to move

Wednesday, November 7, 2012

07112012


Nifty opened within previous day range. Market was very nervous waiting for US results. When Obama won it broke PDH and gave a nice BPB to go long.It gave a good 30 points. I was looking to short the retest of HOD. But Market reversed early.Anticipated a BPB of BRN.This one also did  not happen

Tuesday, November 6, 2012

06112012

Nifty Opened near PDH. IR formed and later another range overlapped it. BPB of Range high gave a long signal. Scratched the trade later.Missed the final up move.

Monday, November 5, 2012

05112012

Nifty opened within previous day range. BOF of IR high/ PDC gave a short signal. Scratched when BO of IR low failed. Went long on the second test of PDL.This trade moved as expected.

Friday, November 2, 2012

Small Stuff


Lack of attention to details can cause big problems. This is applicable in every walk of life. A slightest mistake or loss of focus of a Surgeon  can result in a tragic situation. A loose bolt or a misplaced pin may cause a plain crash. In such professions each step of the entire process is given complete and careful attention

As a Trader are you paying attention to the details? Successful traders understand the importance of details. Entire trading environment is simply an accumulation of small details. Lack of attention will lead to under performance, wasted opportunities and inconsistencies.

Habit of paying attention to details does not come naturally. We need to train ourselves. Careful observation is required to absorb and digest everything. We must discard all the unwanted variables and focus only on actionable stuff.

Concentration is the key to details. Do not multi task. Forum postings and bloging can wait. Better to avoid chat rooms during market hours.

Creating a check list will help a lot. Write down important things. Do not rely on your memory, at least during initial period. Organize and plan everything in advance.

Consistent attention to these small details produces trading excellence. That is why we must all sweat the small stuff.

ATD (Attention to Details) is the key to ATD (Achieve the Dream)

02112012

Nifty gaped up above PDL.IR formed. Long on the break of IR high. Scratched the trade later.

Thursday, November 1, 2012

01112012


Nifty opened within previous day range.IR formed. BOF of IR low gave a long signal.This trade moved well..TST of PDH gave another long TP near day high.

Wednesday, October 31, 2012

31102012


Nifty  opened within previous day range. Initial range formed. Skipped BOF of PDL as bias was bearish. IR formed. Later another range enveloped it.BOF of IRL gave a long signal. TP at Range High. Went short on BOF of Range High.Stopped out.

Tuesday, October 30, 2012

30102012


Nifty opened within previous day range. Did not attempt any trades till dust settled after RBI announcement. Went long on the BOF of LOD. This trade did not move . Scratched.

Monday, October 29, 2012

Reading: The Trading Contradiction

One of the real contradiction traders face is that the forces that attract people to trading are exactly what make them lose in trading.
For most traders, trading is attractive because they can:
  • Make a lot of money - greedy
  • Get rich quickly - impatient
  • You have the best commute - lazy
  • Make a good living trading only 2 hrs every day. - super lazy
  • Live anywhere - mercurial
  • No bosses or employees needed - poor social skills
  • Be unaffected by economy, political shifts, natural disasters, etc. - fearful
  • No hard assets, office space, etc needed. - unattached.
As you can see, the worst developed personalities are naturally attracted to trading and its no wonder that 80% of traders lose everything they ever put into trading. To be successful, you need to fight the very qualities that brought you to trading in the first place. This is the contradiction that traders face on the very first day that they begin to trade.

Once you acknowledge that just choosing to be a trader automatically sets you up for failure, you have the opportunity to amend the very qualities that brought you to trading and modify yourself to be the very opposite and thus be successful.

Cadver
http://ninetrans.blogspot.in/

29102012

Nifty opened near PDC. Skipped BOF of IRH as there was no space for the price to move.BOF of PDH/HOD gave a short signal.BPB of DO/IRL was another opportunity,BOF of LOD and TST of PDL gave a long signal.This one also gave some profit

Sunday, October 28, 2012

Probability


“Trading is a probability game”. You might have read it a thousand times. I think many of the traders have not understood this or have misunderstood this. There is much difference between betting on the probabilities of a method with an edge and using statistical probability to find an edge.

To trade the Markets profitably, we need a method with an edge. Edge is nothing but a positive expectancy. As we all know well, there are no certainties in the Market. Anything can happen at any time. We must trade the method long enough, ignoring the individual trade results, to make this positive expectancy to work in our favor.

Working on statistical probabilities to find an edge in the market is altogether a different ball game. It is not easy as we think. For example, after an elaborate study, we find that 70% of the gap ups fill on the same day and we conclude shorting the gap ups at the open could be a profitable strategy. Sure it is not going to work.

There are many logical fallacies that could distort the studies. Many statistical tests calculate correlation between variables and in many cases correlations does not imply causation. It will be totally wrong to conclude two events that occur together are taken to have a cause-and-effect relationship. To cite an example all the momentum moves in the market will be preceded by an MA cross over. But acting on all the MA crosses is not going to make you money

Spurious relationships are much more dangerous. Some times two events or variables have no direct causal connection, yet it may be wrongly inferred that they do. This could be due to mere coincidence or there could be an unseen factor.

Market is a place where countless people executing countless strategies at any point of time. Each and every trader is a variable who can change the direction of the Market, at least theoretically. Every moment in the Market is unique and probabilities themselves shift from moment to moment.

In my humble opinion, statistical probability studies alone are not enough to find an enduring edge in Markets.

Tuesday, October 23, 2012

Classic Patterns


I do not trade classic chart patterns. People have written Encyclopedias on this subject. Many of these patterns can be traded, if you know where to look for them.Unfortunately many masters have no clue

Location where they occur is more important than the pattern itself. Observe closely when price hangs around a Decision Point or an important Flip Zone. You will identify many tradeable classic patterns

Frankly, yet to find a way to trade Jerry's Dragon Pattern and HPT's C&B Pattern.

23102012


Nifty opened within previous day range. Initial move was down. IR formed. BOF of IR High gave a short signal. Covered at the BOF of IR low.BOF of LOD gave a long signal . I expected it to move well, but it did not. Scratched.

22102012

Nifty gaped down within previous day range Failure to continue down gave a long signal. Went long with stop loss below PDL. BOF of PDH gave a short signal TP at BRN. Did not attempt the BOF of BRN. Nifty channeled the rest of the day.

Sunday, October 21, 2012

The SAR Circus


SAR (Stop and Reverse) is a market neutral trading system that is always in the market. It automatically gets you long when market is going up and short when the market is going down. Stops are reversal points. People follow different methods to calculate SAR levels. It can be moving averages, Bollinger bands. Pivot points, some market profile levels etc.

I have very keenly observed the development of some SAR systems. Very simple mechanical systems later became very complicated and discretionary. More and more tweaks and rules were applied on it. Tweaks involve multiple lot entries, partial exits, re entries and filters.

I just could not understand the use of filters. SAR is just a number that helps you to stay on the right side of the price move and not a barrier to price move. Further, multiple lot entries and partial exits will do more harm than good. The basic concept of the system is to sit tight through the whipsaws and capture a big trend move. Here you will end up getting whipsawed in multiple lots and cant capture the full benefit of the coming trend move due to partial exits.

Markets are cyclical in nature and alternate between trends and ranges. Expect a lot of whipsaws during the ranging period and never forget Market ranges 70% of the time. We may need to take all the signals as we will never know which one is going to be a home run. During the trend moves you will be able to recoup your earlier losses for sure. But once the market start to consolidate and range again you will give back everything and will be back to square one.

Another problem occurs when you want to scale up your trading. After gaining some decent profit you become confident and double your stake. Immediately market decides to range and wipe out the entire profit earned during the past in no time. Long term profitability of a SAR system cannot be judged with two or three years of data and back testing as the market cycles may vary. Profitability will depend on where you start and where you quit. Hard core SAR specialists can always paint a rosy picture like the wayside fruit seller, who always hides the rotten apples behind the fresh ones. Do not question them. They always keep their “Discipline” cane handy

In my humble opinion, Market will not give you any static edge. Why should Hedge funds spend millions of dollars hiring specialists for research? Why mutual funds are struggling to produce alpha? It is a shame that Goldman Sachs and Credit Suisse professionals are not aware of this wonder method.

I will not advise you to stay away from SAR methods as I have not traded this method live and have no right to say so. I am not responsible if you miss a fortune by not trading the method. I will suggest you to try a plain vanilla SAR method for a very long time. Be prepared for a life long Roller Coaster ride.

I am approaching fifty and I have neither the time nor the patience for this endless Snake and Ladder game.